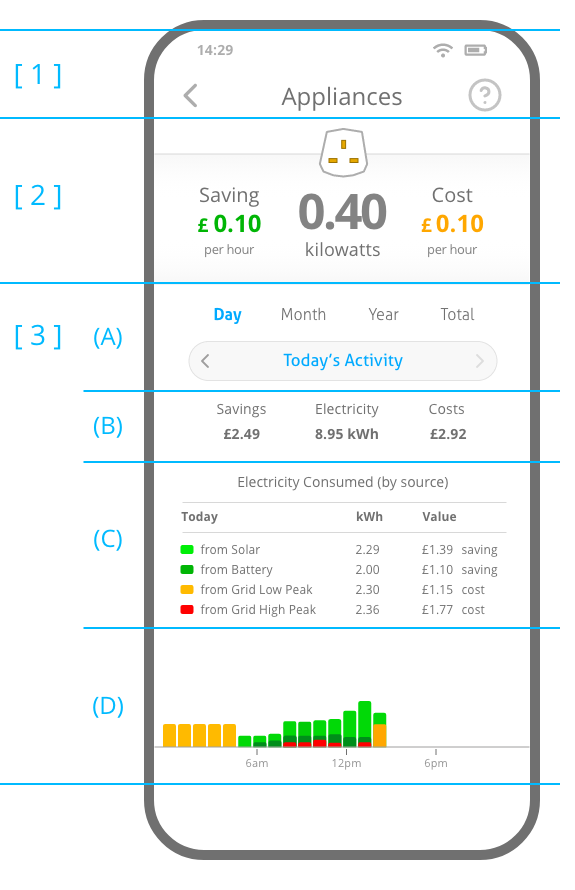
The Appliances Screen displays the consumption of all electrical devices in your property that are not individually monitored by the EMS (such as the EV Charger), the value of that energy, and the electricity that your appliances have consumed on a given day, month, year, or in total.
You can add monitoring and wireless control to individual appliances using Encom Smart Plugs and other EMS monitoring accessories (coming soon).
The sections of the Appliances Screen are as follows:
Click on the arrow icon to go back to the Home Screen.
Click on the Support icon to view the Appliances section of the User Guide, appliances specific FAQs, to send feedback, and access further support information.
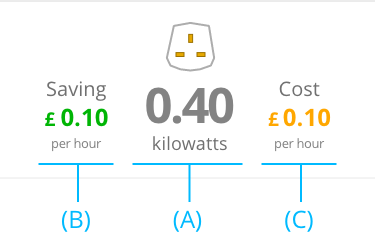
[ 2 ] Appliances Activity Section
This section displays the amount of electricity your appliances are currently consuming (A), how much savings your Solar and Battery System is providing (B), and the cost of any Grid electricity that your appliances are currently consuming (C).
The Savings value (B) is the combined savings from your Solar PV panels and Battery. It is calculated from the amount of solar generated electricity and battery stored electricity that your appliances are consuming. See the Solar PV page and the Battery page for further details on how the value of each electricity source is calculated.
The Cost value (F) is the amount of grid electricity that your appliances are importing to supplement the Solar and Battery electricity. See the Grid page for more details on how the value of grid electricity is calculated.
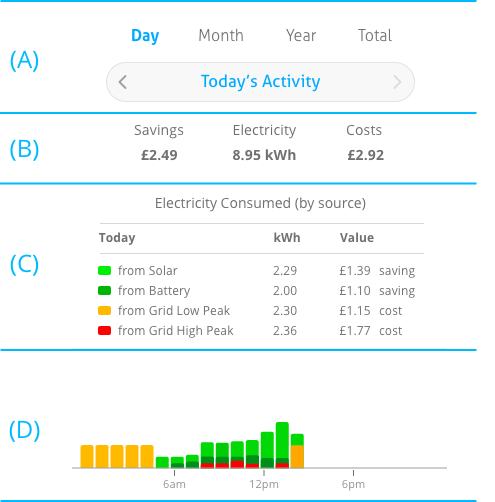
[ 3 ] Appliances Charts Section
This section displays your appliances consumption activity over a period of time, when they used electricity and from what source, and a chart detailing your appliances electricity usage at any given time.
Using the date selector (A) you can view the consumption of you appliances for a given day, month, year, or your appliances total electricity usage since the EMS was installed.
The reports section (B) details the consumption of your appliances in the selected time period, how much you saved, how much electricity the appliances used, and the cost of any grid imported electricity.
The summary table (C) details your appliances electricty usage over a given time period, and which source the electricity came from.
The column chart (D) presents your appliances electricity consumption throughout a given day, month or year. Pressing any of the columns in the chart will update the summary table (C) above with the values for that time period.