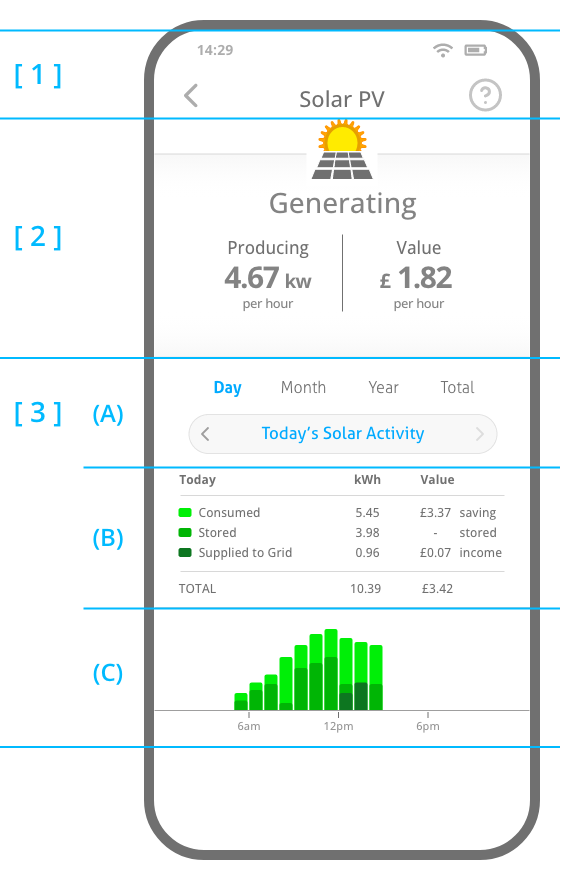
The Solar Photovoltaics (PV) Screen displays how much energy you are generating, the value of that energy, and what you have generated on any given day, month, year, or in total.
The sections of the Solar PV Screen are as follows:
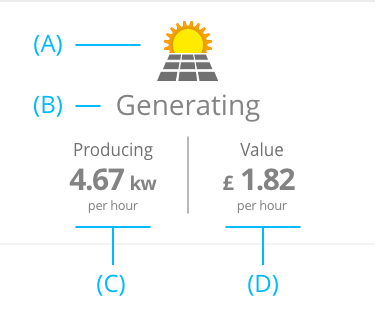
The sections of the Solar PV Screen are as follows:

Click on the arrow icon to go back to the Home Screen.
Click on the Support icon to view the Solar PV section of the User Guide, Solar PV specific FAQs, to send feedback, and access further support information.
This section displays the current status of your Solar PV panels (A) and (B), how much electricity they are generating (C) and the value of that electricity (D).

The value of your Solar generated electricity is calculated from the amount of it you are consuming in the property, the amount of it that is being stored in the battery, and the amount of it that is being exported to the Grid.
Any solar electricity that you are consuming is valued at the rate of your Grid tariff, equal to the price of electricity had you imported it from the Grid. The price of your Grid tariffs are based on the values you entered in the Grid Tariff Settings. If you are taking part in an EMS Pilot then your Grid Tariff Settings have already been preconfigured by Encom.
Any solar electricity that is being stored in the Battery does not yet have a value. It will be valued when the solar stored electricity is discharged and used in the property or exported to the grid.
Any solar electricity that is being exported (supplied) to the Grid is valued at the rate of your Grid Export tariff.
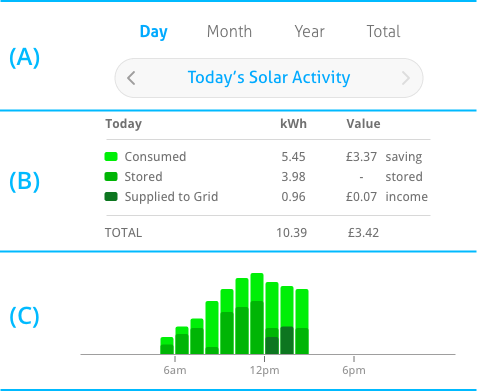
This section displays todays Solar PV generation, how the electricity was used, and a chart detailing the performance and usage over a given period of time.
Using the date selector (A) you can view the performance for any given day, month, year, or the total performance since the system was installed.

The summary table (B) details the total generation and how the solar electricity was utilised over a given time period.
The column chart (C) presents the generation and usage across a given day, month or year. Pressing any of the columns in the chart will update the summary table (B) above with the values for that time period.